Resource Explorer
Overview
Resource Explorer is a powerful tool for visualizing, understanding, and managing cloud costs and usage over time. With Resource Explorer, you can group your costs based on various dimensions and apply filters such as Cloud Accounts, Regions, Services, Product Families, TAGs, Charge Types, and more. Then, you can see all the important metrics, such as forecasted costs, trends, month-over-month costs, and more. Our customers often create several Scopes such as Teams (Engineering, Product, etc...), Environment (Prod, Dev, Staging, etc...) and then apply budgets and budgeting alerts for each Scope.
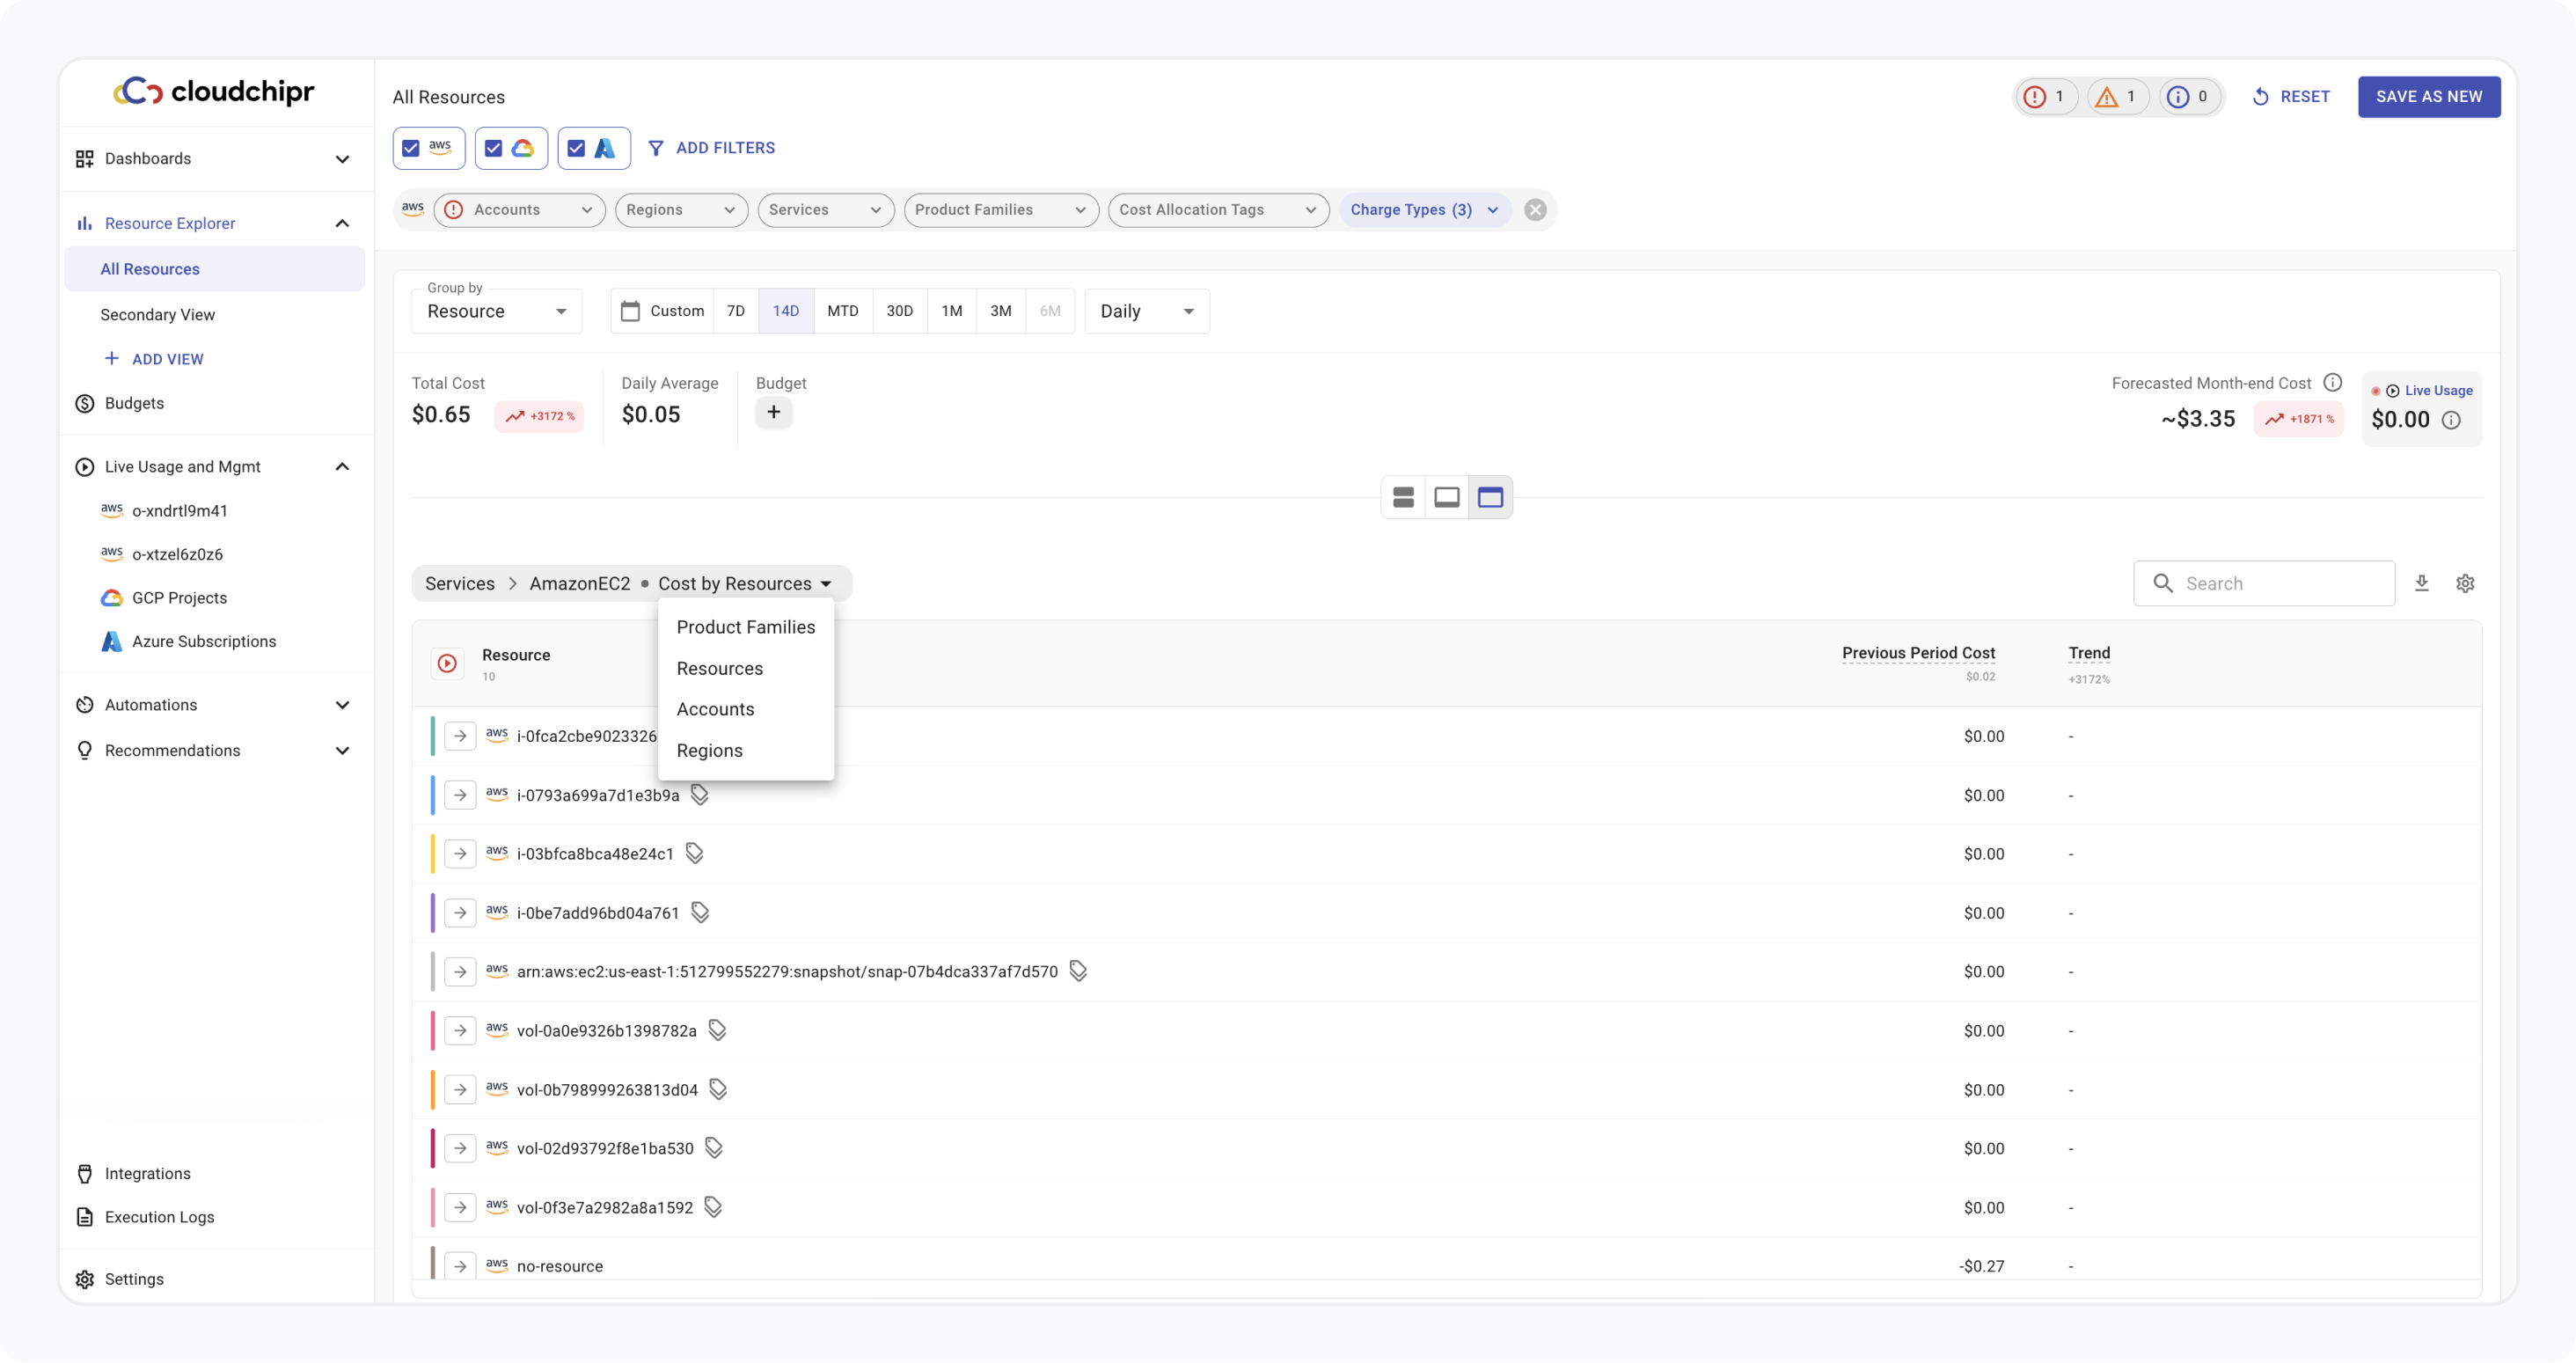
Resource Explorer also has a very powerful way of exploring resources in a table view and going down by a specific dimension through your resources tree. For example, you can group by Accounts, then click on the specific Account and go down from Services to a specific resource to see what it is charged for.
Cloudchipr makes it super fast and easy to manage multi-cloud bills, budgets, and alerts with just a few clicks.
Resource Explorer Scopes (previously Views)
You can create a custom Scope in two ways:
- You can customize your existing Scope's settings and save the configuration as a new Scope.
- You can select
Add Scopefrom the left menu. The new Scope will have the same configurations as the All Resources Scope, and then you can modify it as you like.
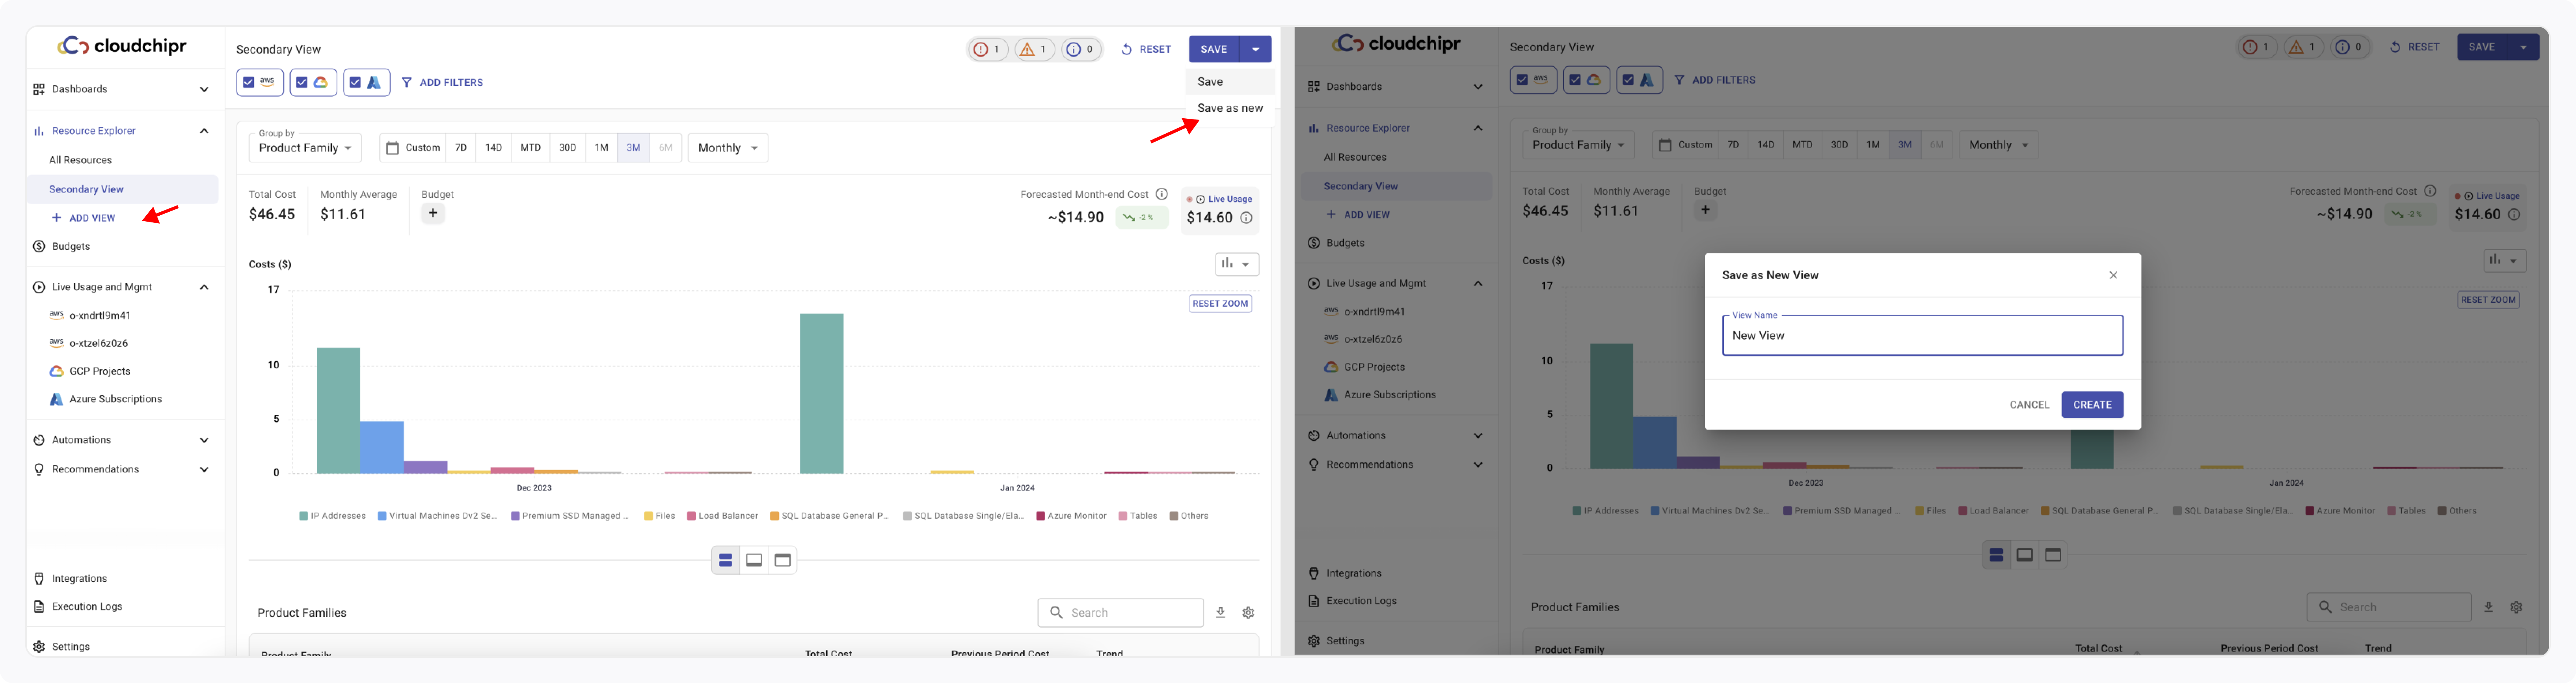
Resource Explorer stores your saved Scopes and lists them in the sidebar under the Resource Explorer section alongside the default view.
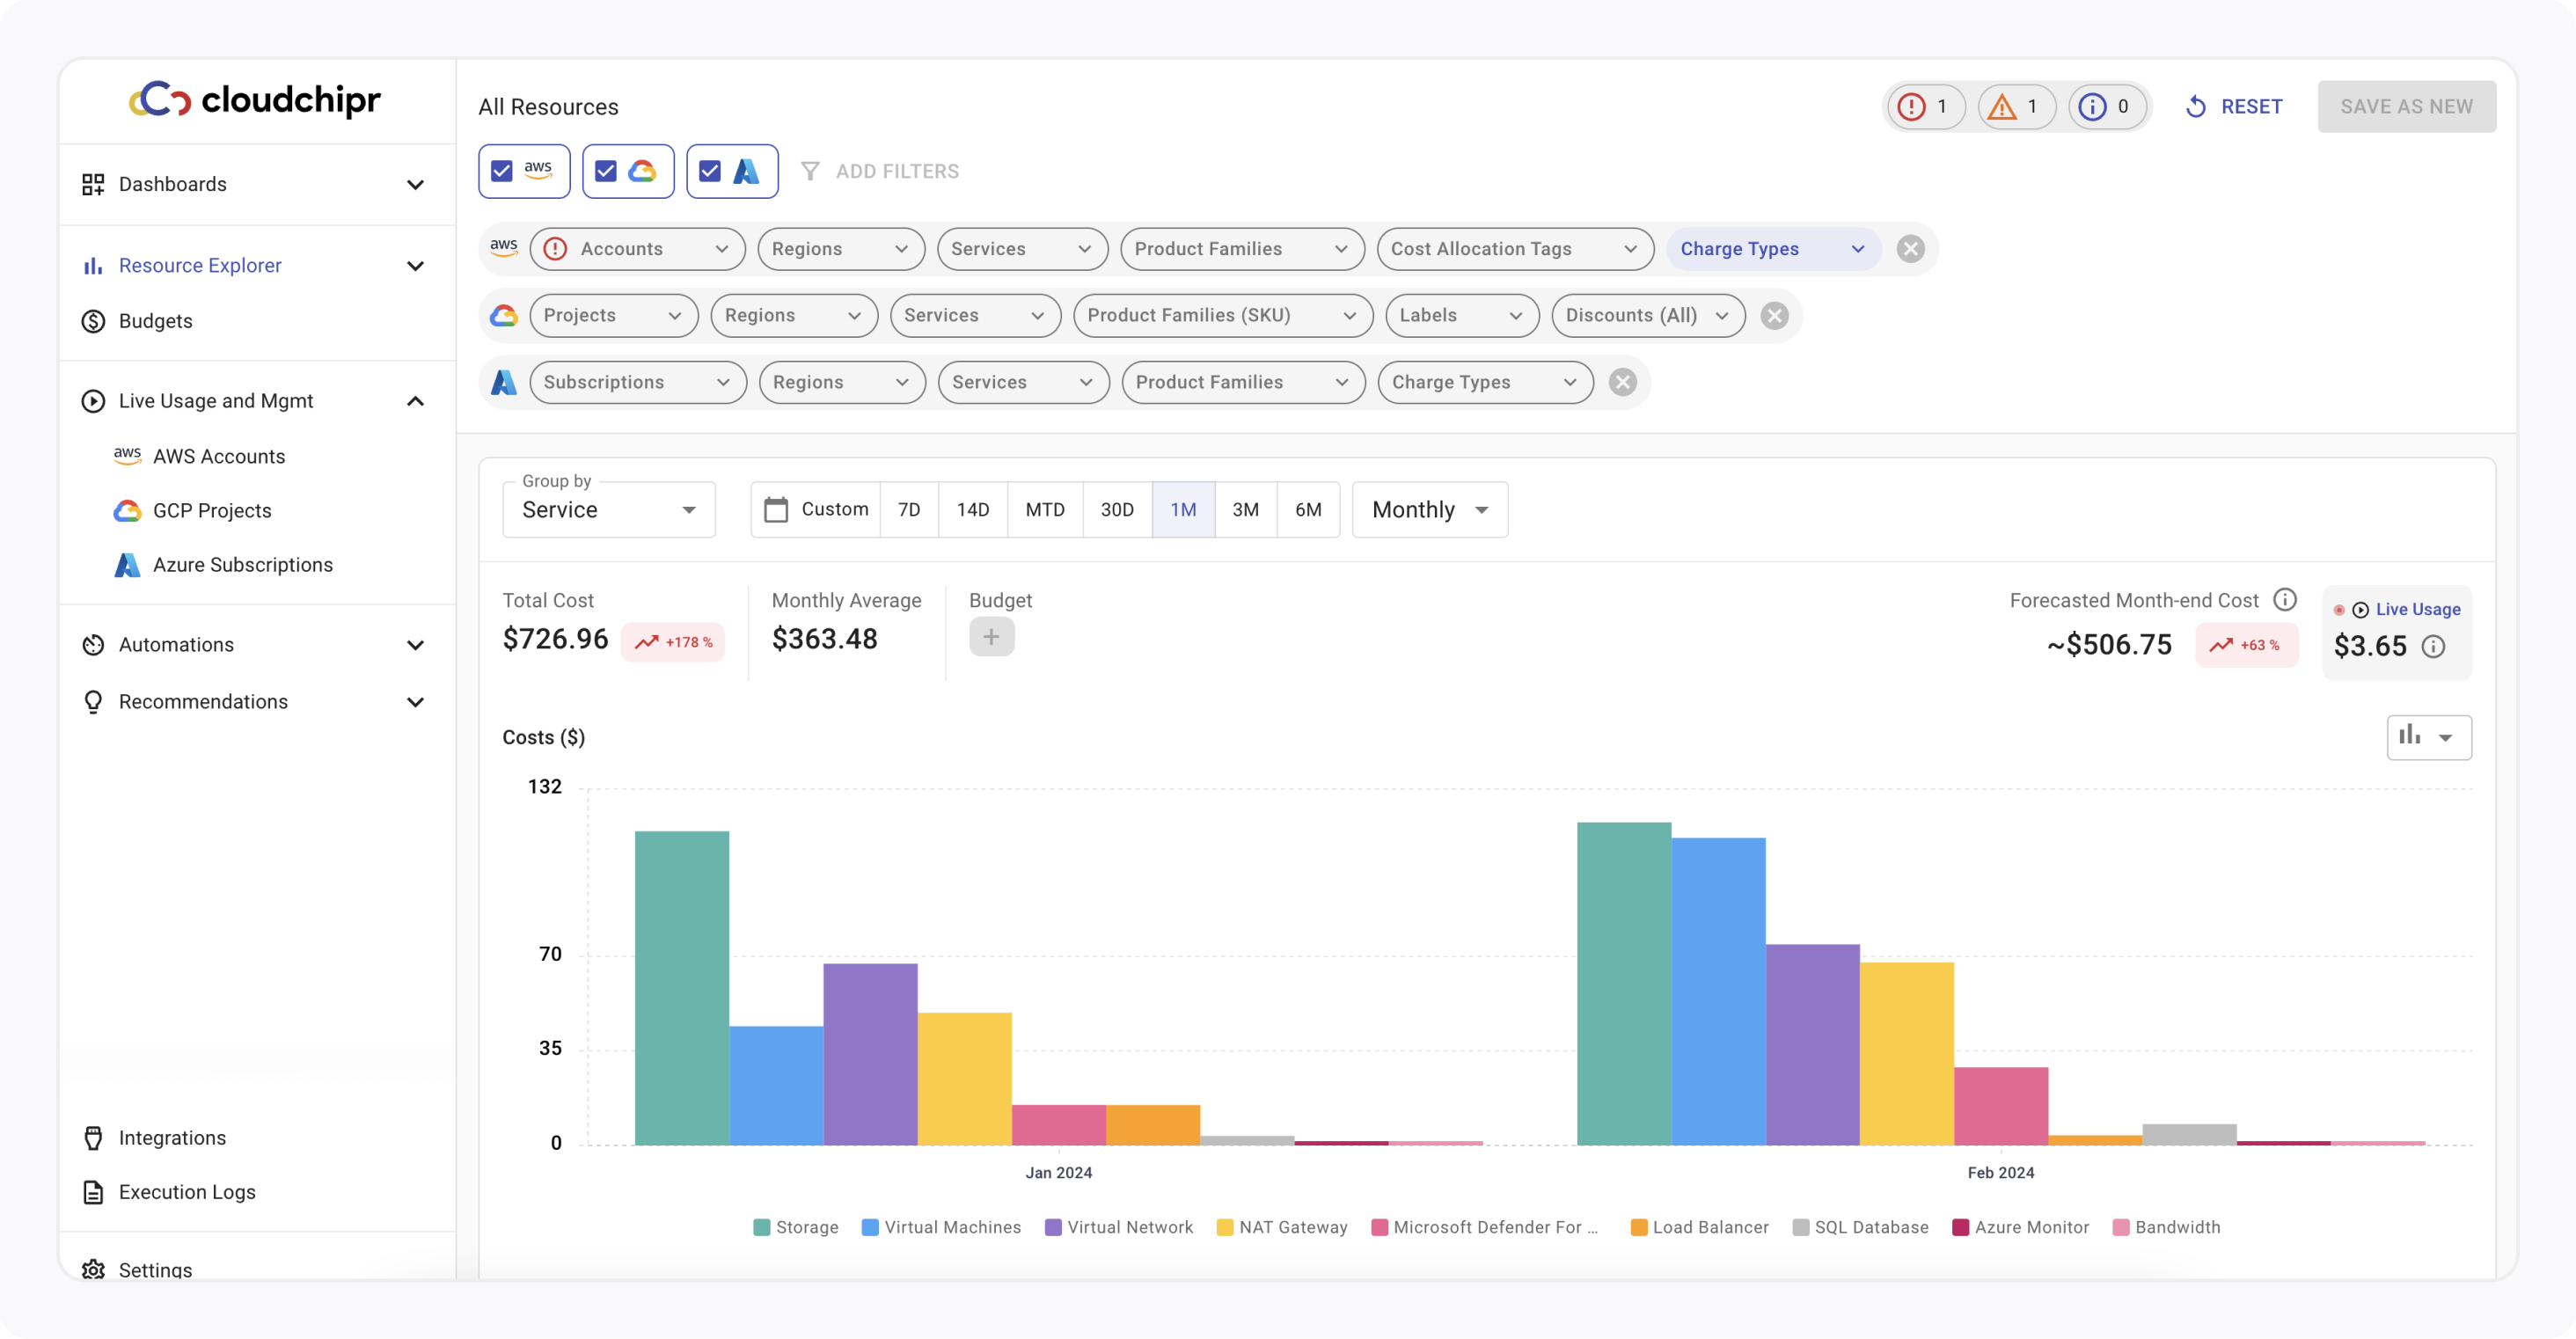
Filters
To apply filters on a specific Resource Explorer Scope, first, click on Add Filters, then pick your cloud provider and filters.
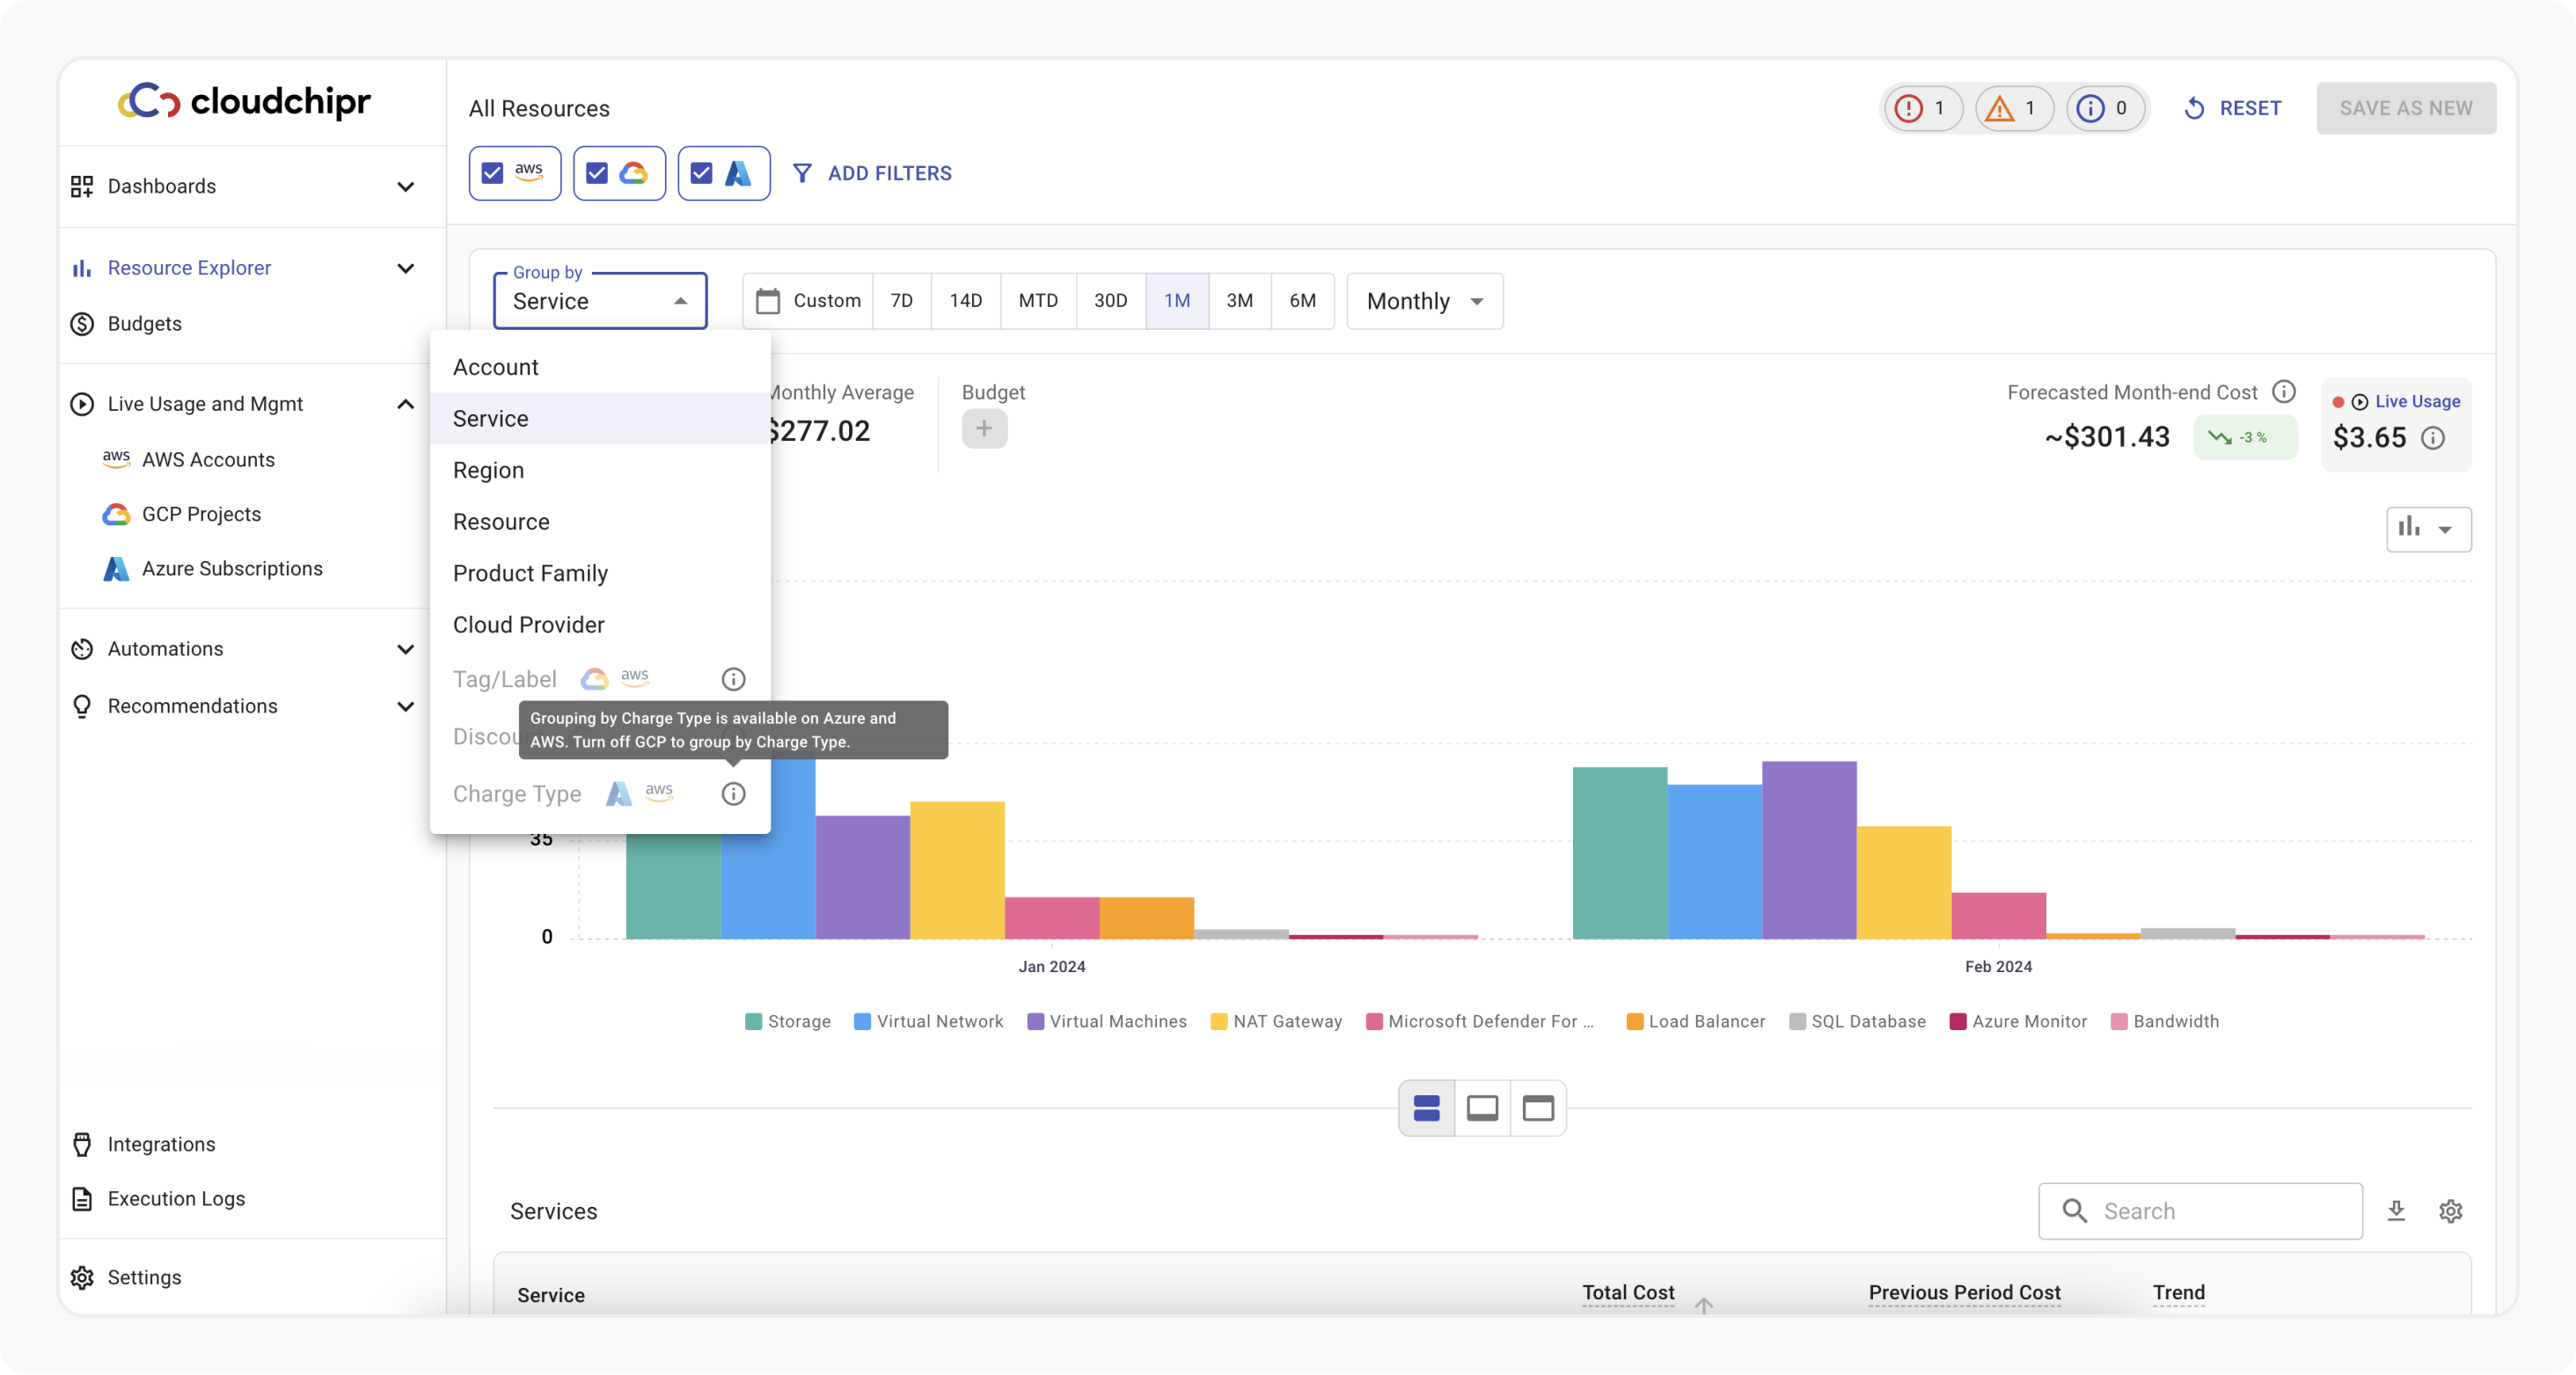
Group By
To view your cloud costs in a different dimension, select a new dimension from the "Group By" dropdown.
You can group by the following dimensions:
- Account
- Service
- Region
- Resource
- Product Family
- Cloud Provider
Additionally, some dimensions are specific to certain cloud providers. For example:
- Tag/Label: available for AWS and GCP.
- Discount: available for GCP.
- Charge Type: available for AWS and Azure.
Date Picker
Set the Date Picker to your desired date range.
Predefined Options:
- Last 7 days: Data from the past week.
- Last 14 days: Data from the past two weeks.
- Month-to-date: Data from the start of the current month to the present day.
- Last 30 days: Data from the past 30 days.
- Last 1 month: Data from the past month including month-to-date.
- Last 3 months: Data from the past three months including month-to-date.
- Last 6 months: Data from the past six months including month-to-date.
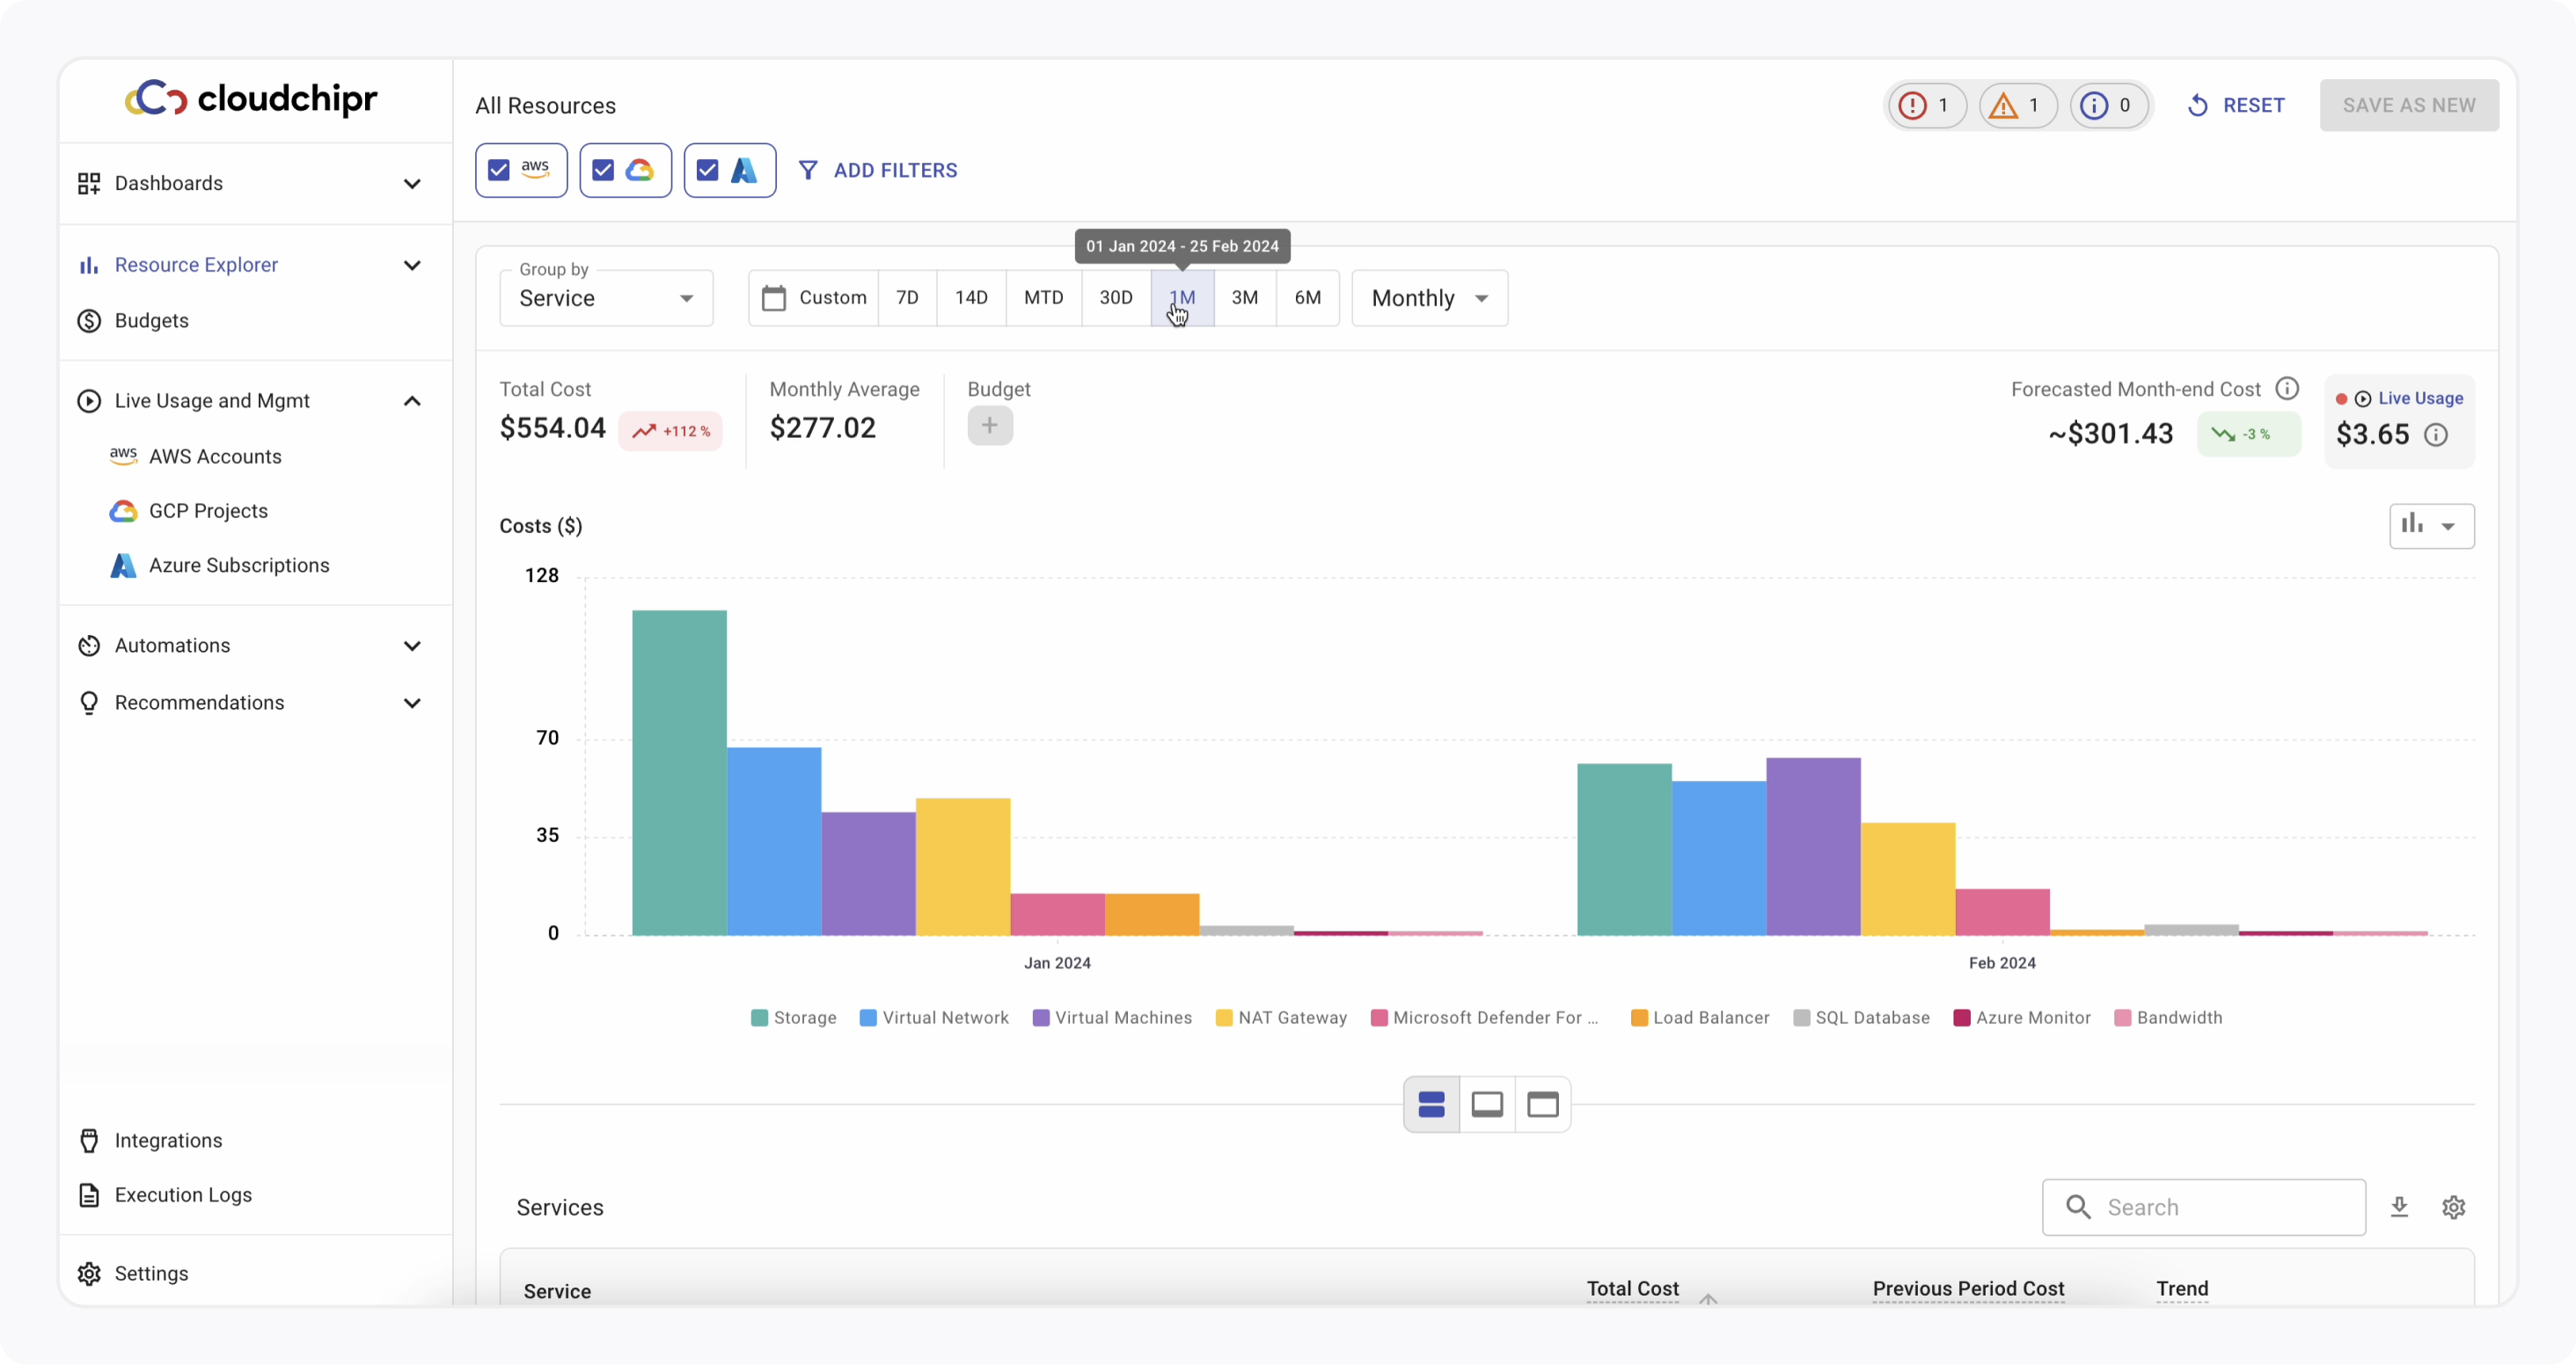
You can choose to view your cost data in monthly, weekly, or daily levels of granularity.
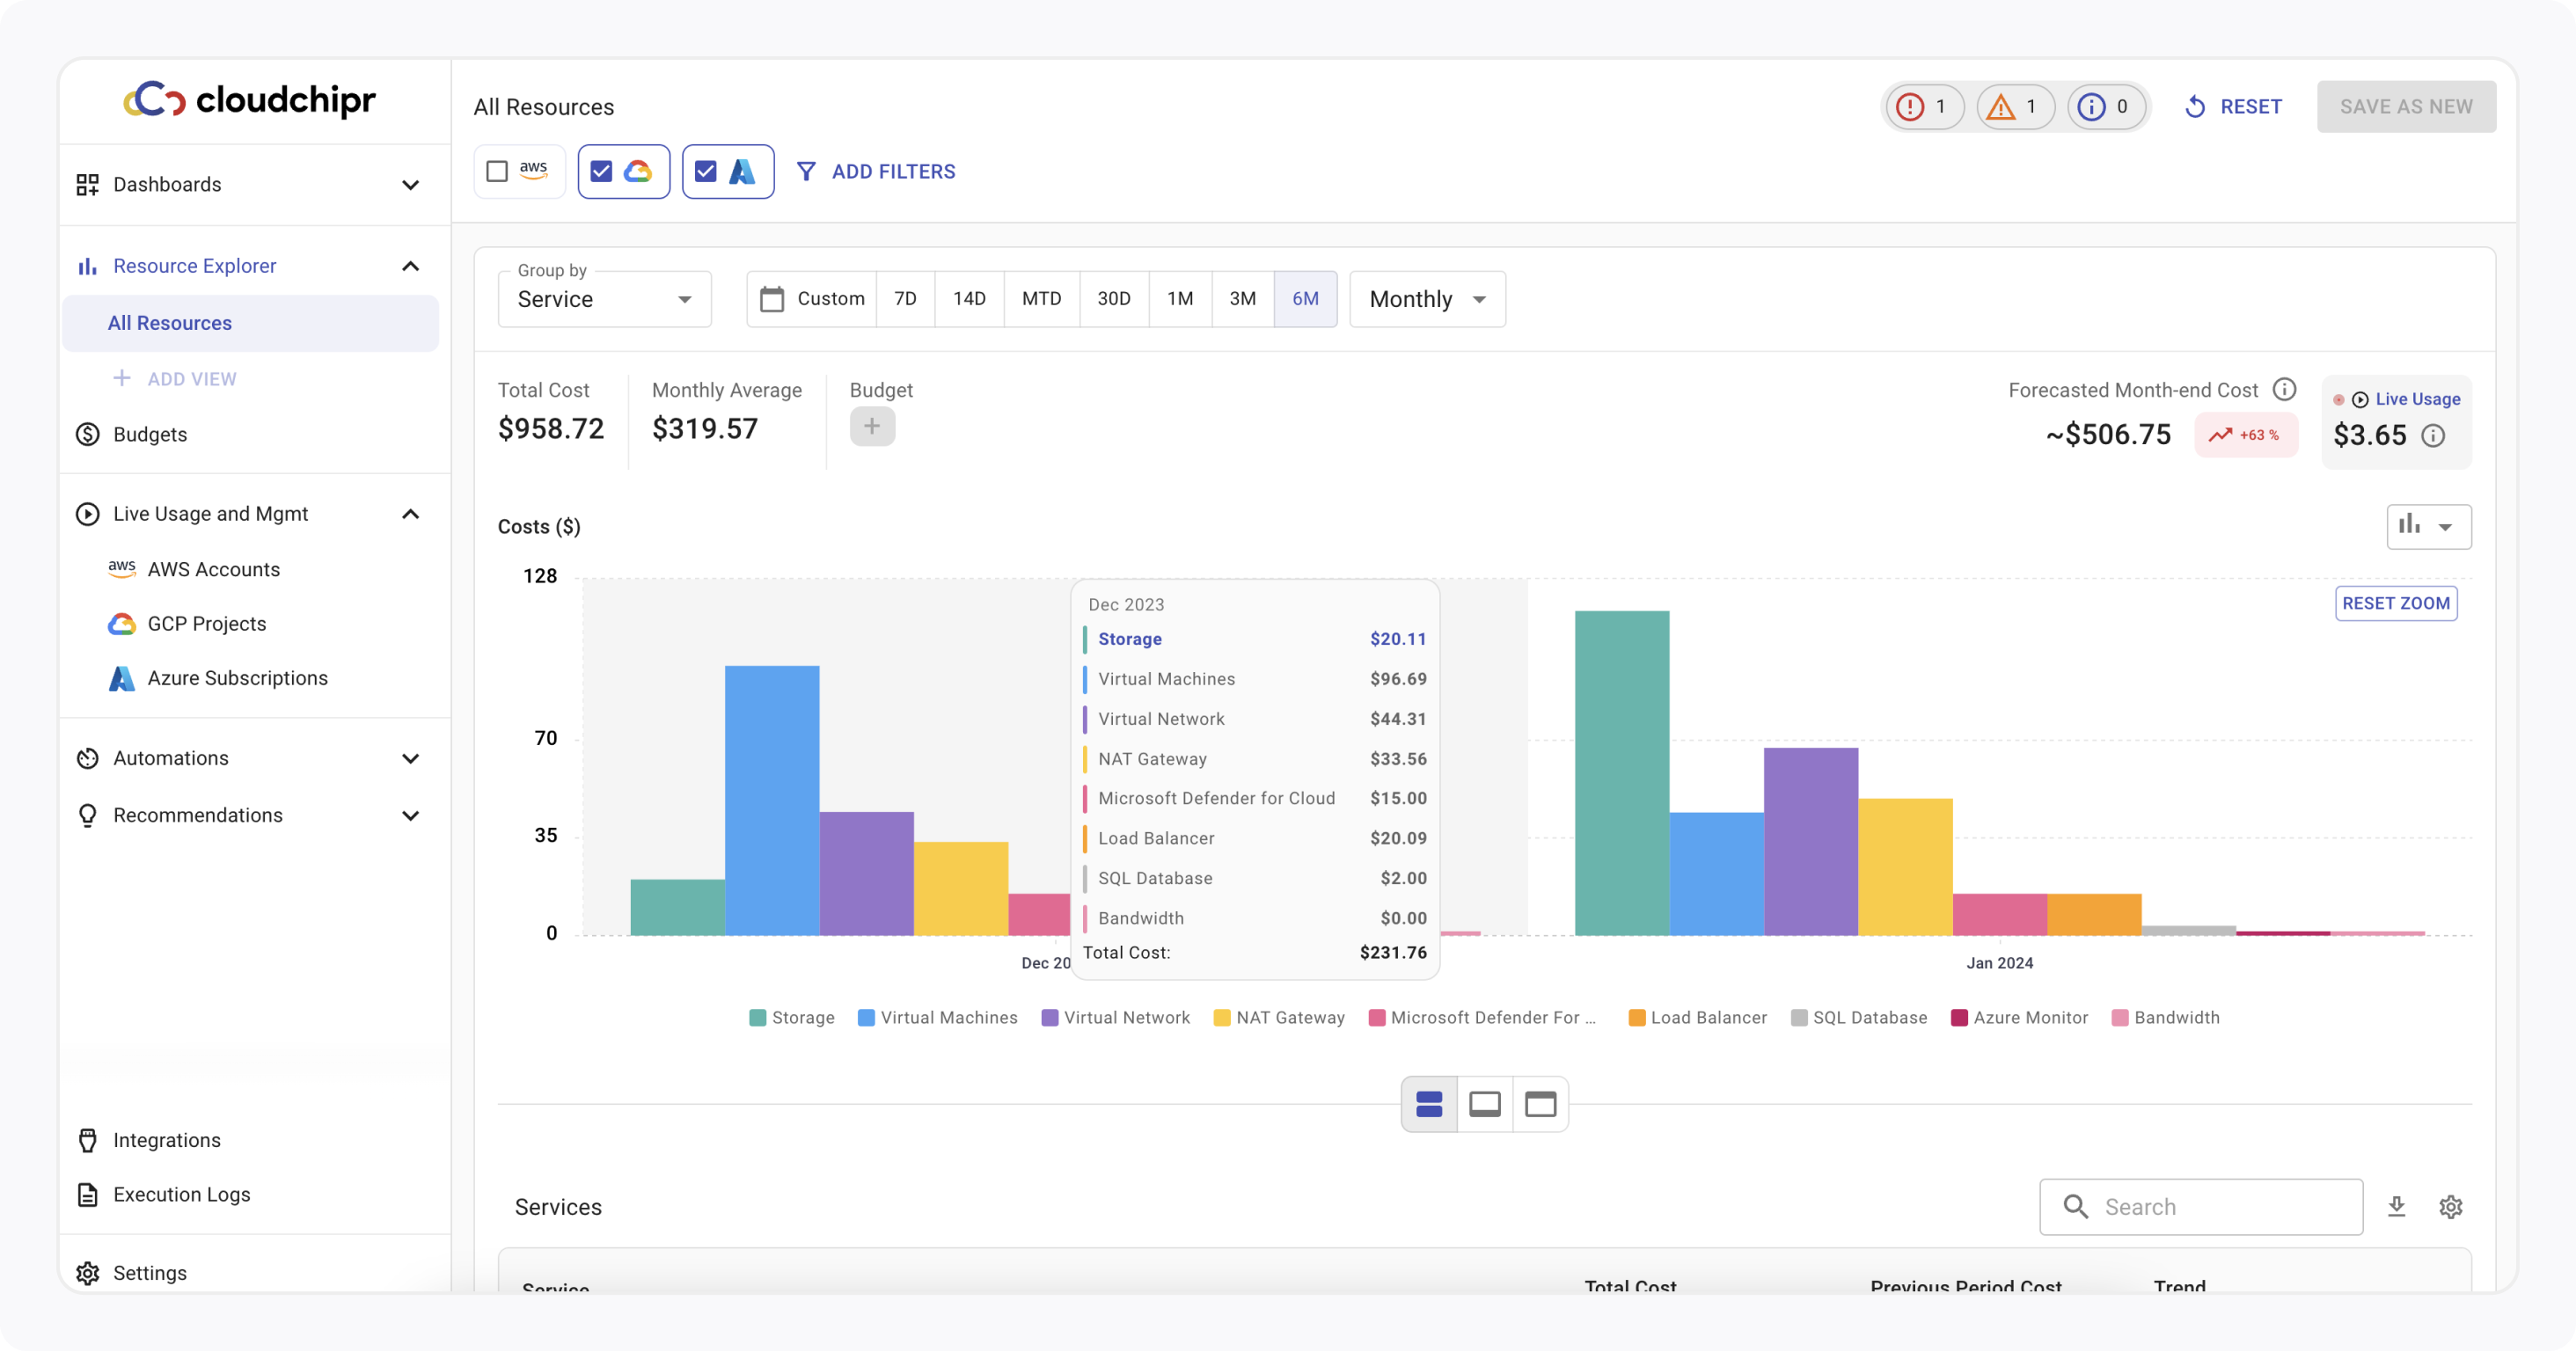
Cost Chart
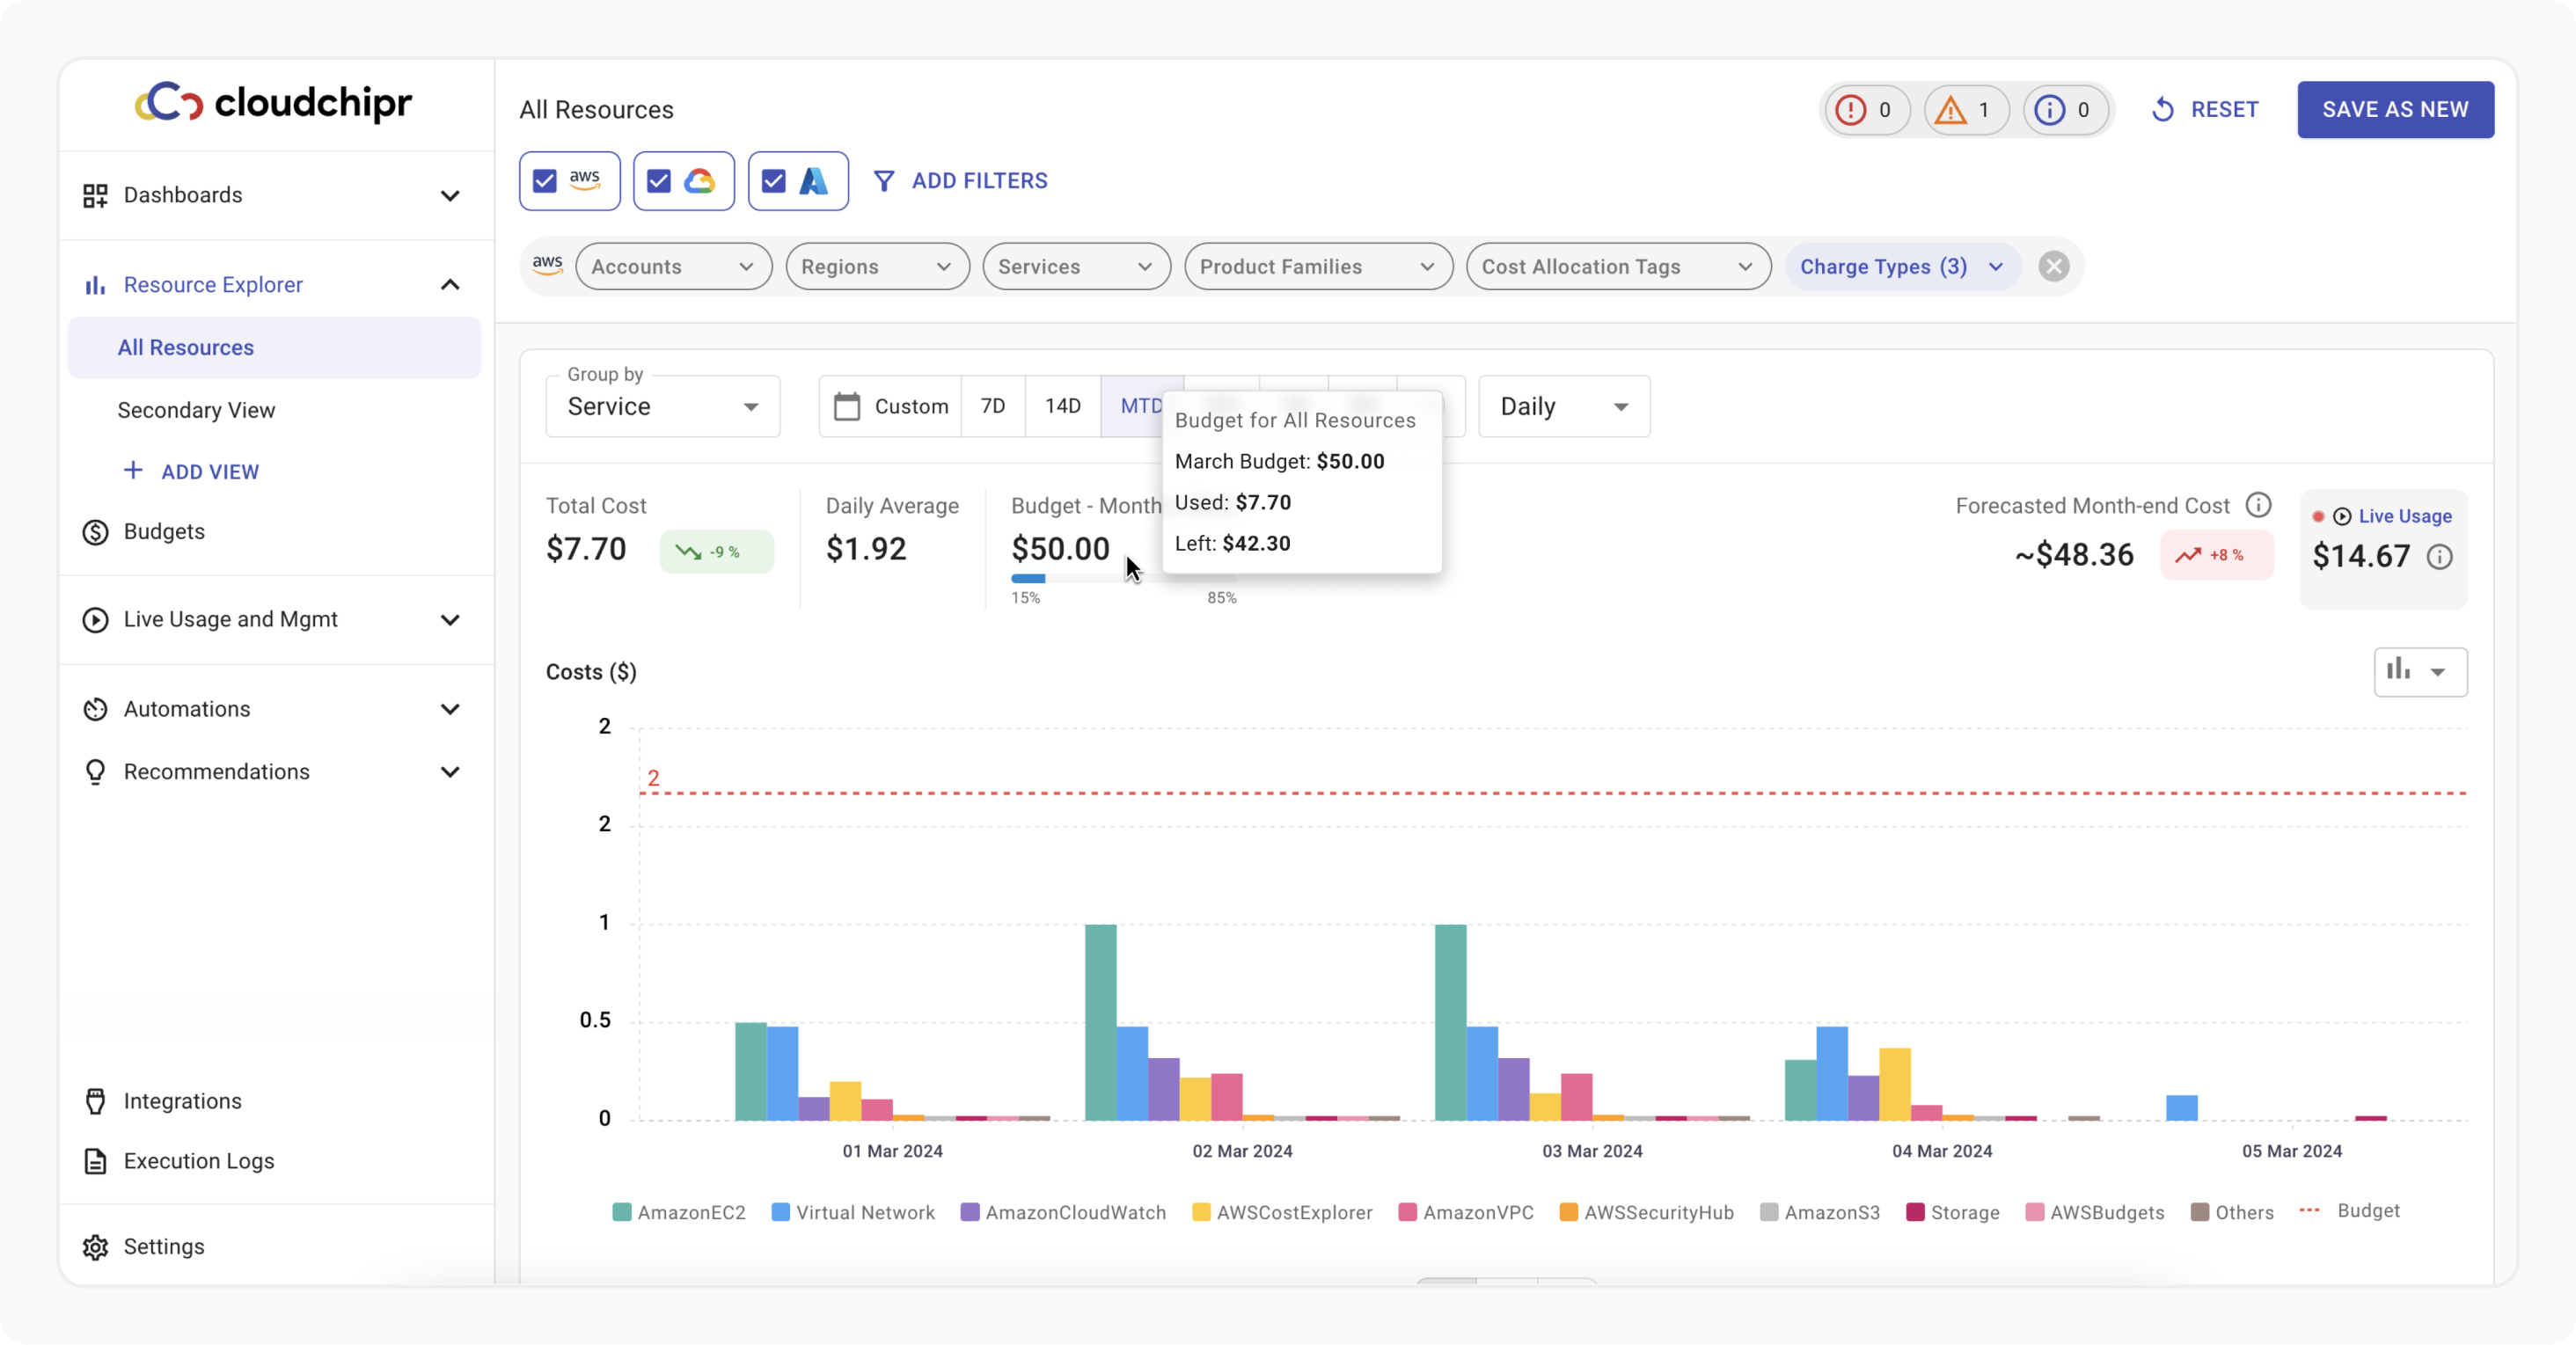
Please see below all the numbers explained.
- Total cost: This is the total cost for the configured date range and the cost trend compared to the previous period. For example, if you are viewing all of your AWS services costs for October, then the trend will show a cost comparison of September and October.
- Daily, weekly, or monthly average: Average cost per day, week, or month depending on the selected granularity.
- Budget: If a budget is set for the Resource Explorer view, you'll see the budget amount, a progress bar, and the budget line on the chart.
- Forecasted cost: By default, the chart area includes the forecasted month-end cost. But you also have the option to select forecasts for three or six month periods.
- Live Filtered: Represents the total monthly cost of filtered resources obtained from Live Usage & Management. It provides you with real-time insights into current spending levels for the resources included in the view.
The chart type also can be changed and Resource Explorer offers a zooming feature for the chart. You can use your mouse to select the specific area you want to zoom in on the chart.
Cost Table
You can delve deeper into the cost details associated with the selected dimension by clicking on specific data points within the table. This feature provides you with a more granular understanding of expenditure within specific segments. For example, when selecting a grouping by "Service," the table presents the list of services, each clickable for deeper analysis.
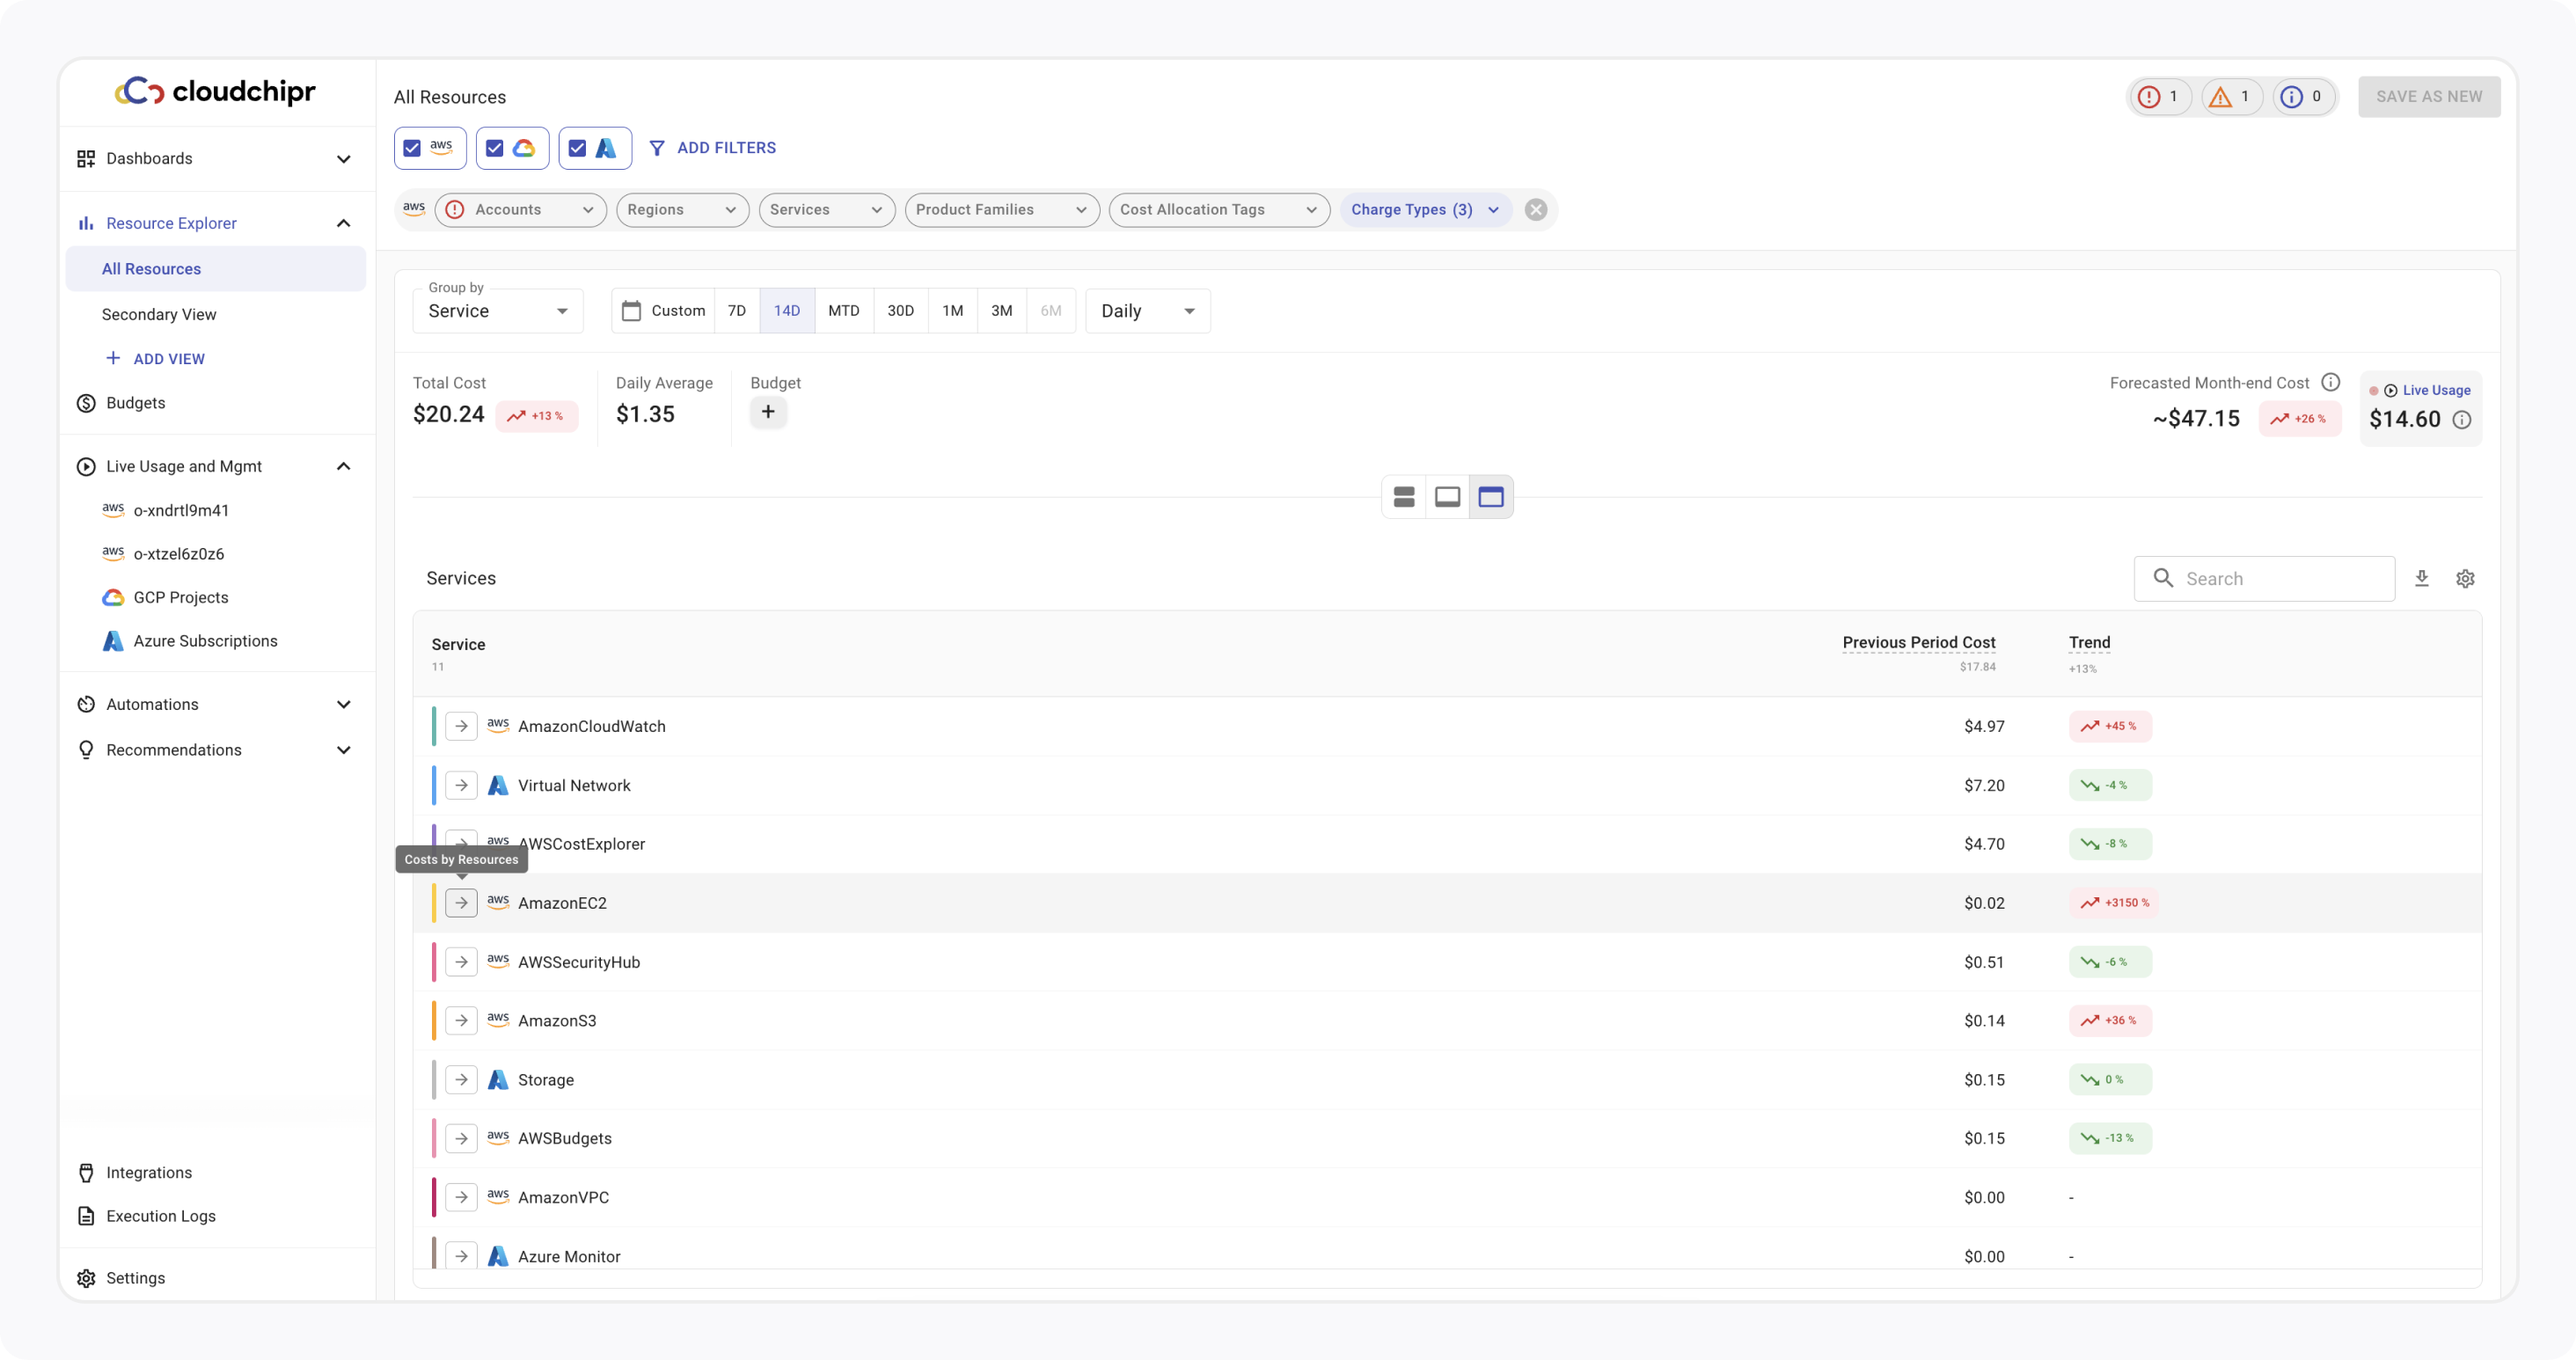
The breadcrumb displays the depth of your current location, showing the hierarchical path from the highest level down to the more specific items you are viewing. It helps you understand how deeply you are navigating and allows for easy backtracking to higher levels.
Here are additional features of the Resource Explorer table:
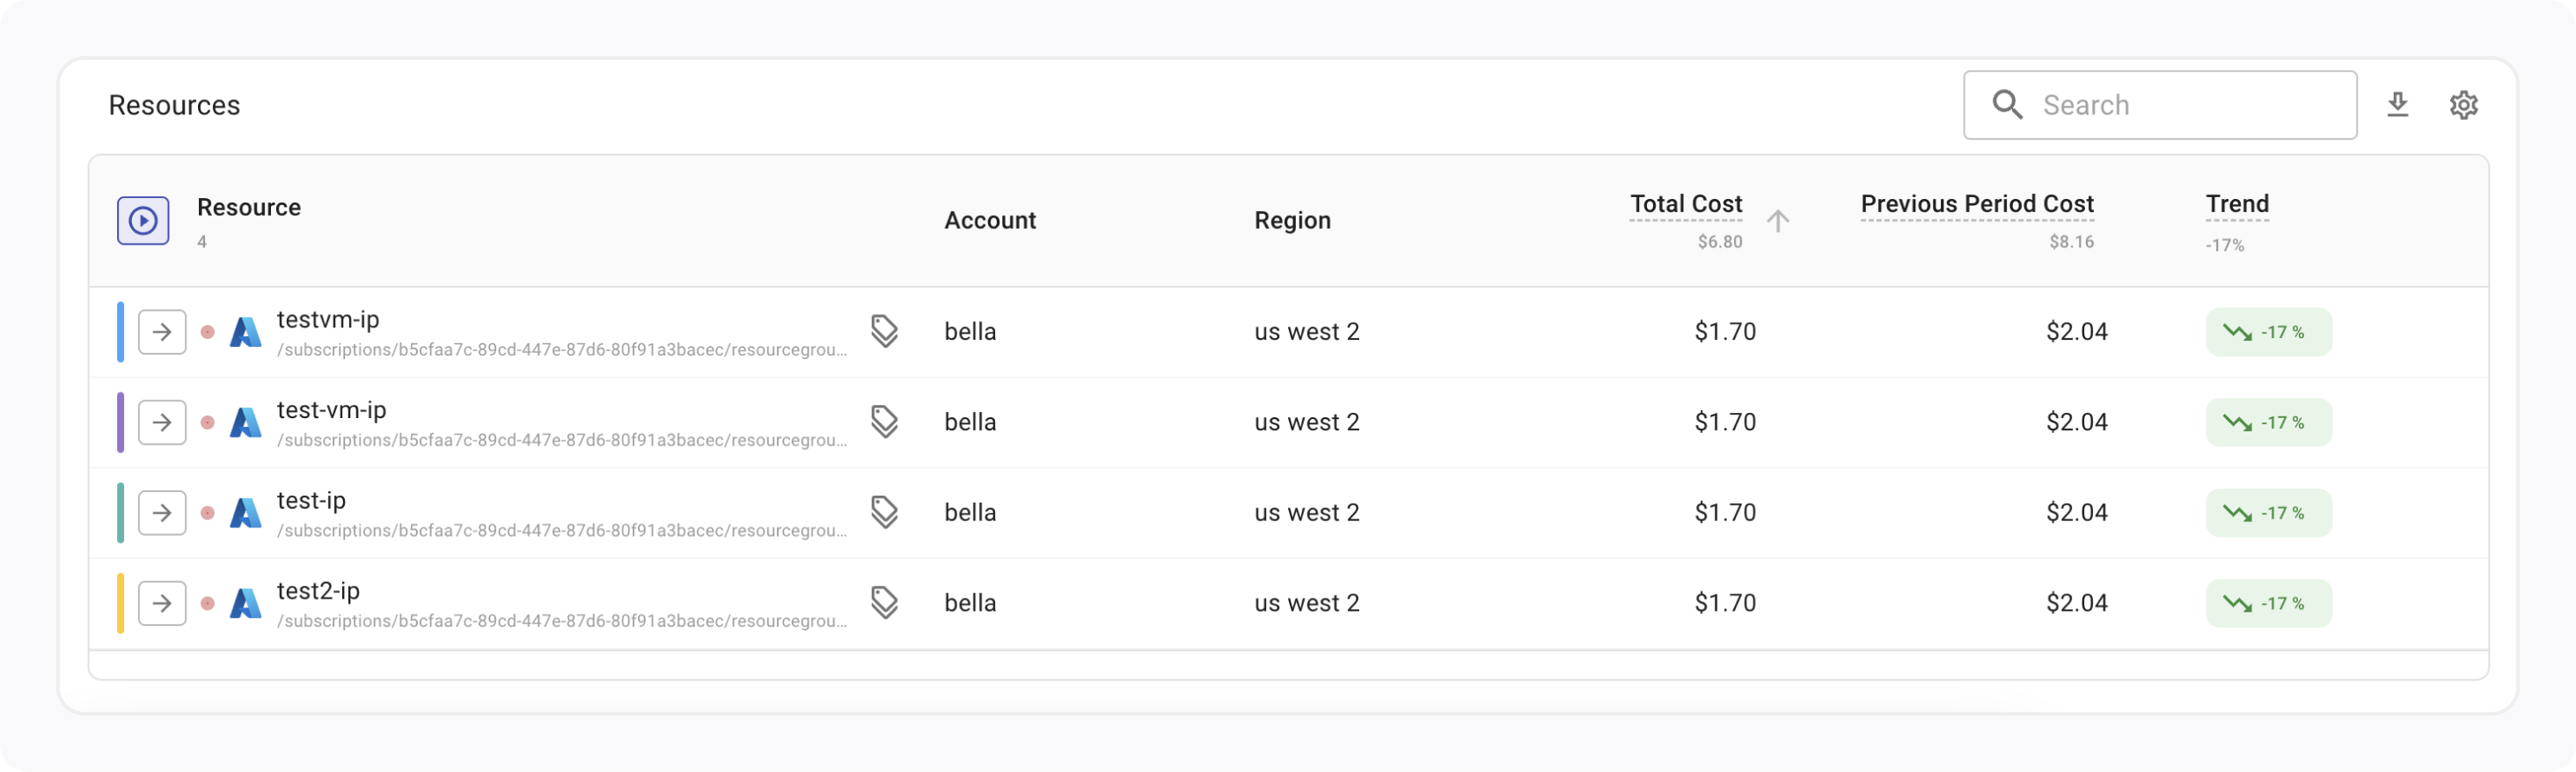
- Exporting Table Data: You can export the displayed information into a CSV file, which can be used for detailed analysis, reporting, or sharing purposes.
- Manage Columns: You can manage the columns displayed in the table.
- Live Filtered Resources: When the grouping is set to "by resources," you can click on a toggle button to view only the live filtered resources.
Set a Budget for the View
If a budget has been created for that specific view, you can easily access budget details. This includes viewing the budget amount, tracking budget progress, including the used and remaining balances, and seeing the budget line on the chart.
If no budget has been created for the specific view, you can click on Create Budget. This action will navigate you to the budget page, where the Select view field will already be pre-filled with the name of the view.
Connecting Account
Upon connecting your cloud account, our system immediately scans it and displays all the resources you are currently utilizing.
Cloudchipr utilizes specific resources from each cloud platform to gather information. These resources include:
- AWS: The "Cost and Usage Report" feature.
- GCP: The "Billing Export" functionality.
- Azure: The "Cost Management" tool.
To ensure that you can view this data in the Resource Explorer tab, please verify that these resources are activated in your account.
Initially, the Resource Explorer displays all services in your account, and within 24 hours, it updates to include the costs generated by each service.
If you have connected your account and enabled the appropriate cost service but are still encountering errors, this could be due to several reasons:
- Cost and Usage Report Deletion: The report may have been manually deleted from your account.
- You don't have permissions to billing data
- Service Limitations: You might have encountered limitations specific to your cloud service. For example:
- AWS Limitation: AWS allows a maximum of 10 cost and usage reports. If you have reached this limit, you may experience issues.
Updated 3 months ago